

Forecast Accuracy Dashboard
Overview: Our Forecast Accuracy Dashboard is the ultimate tool designed to empower your strategic decision-making process by providing in-depth insights into your forecasting performance. This cutting-edge dashboard is a comprehensive solution tailored to help you evaluate and optimize your forecasting accuracy with ease.
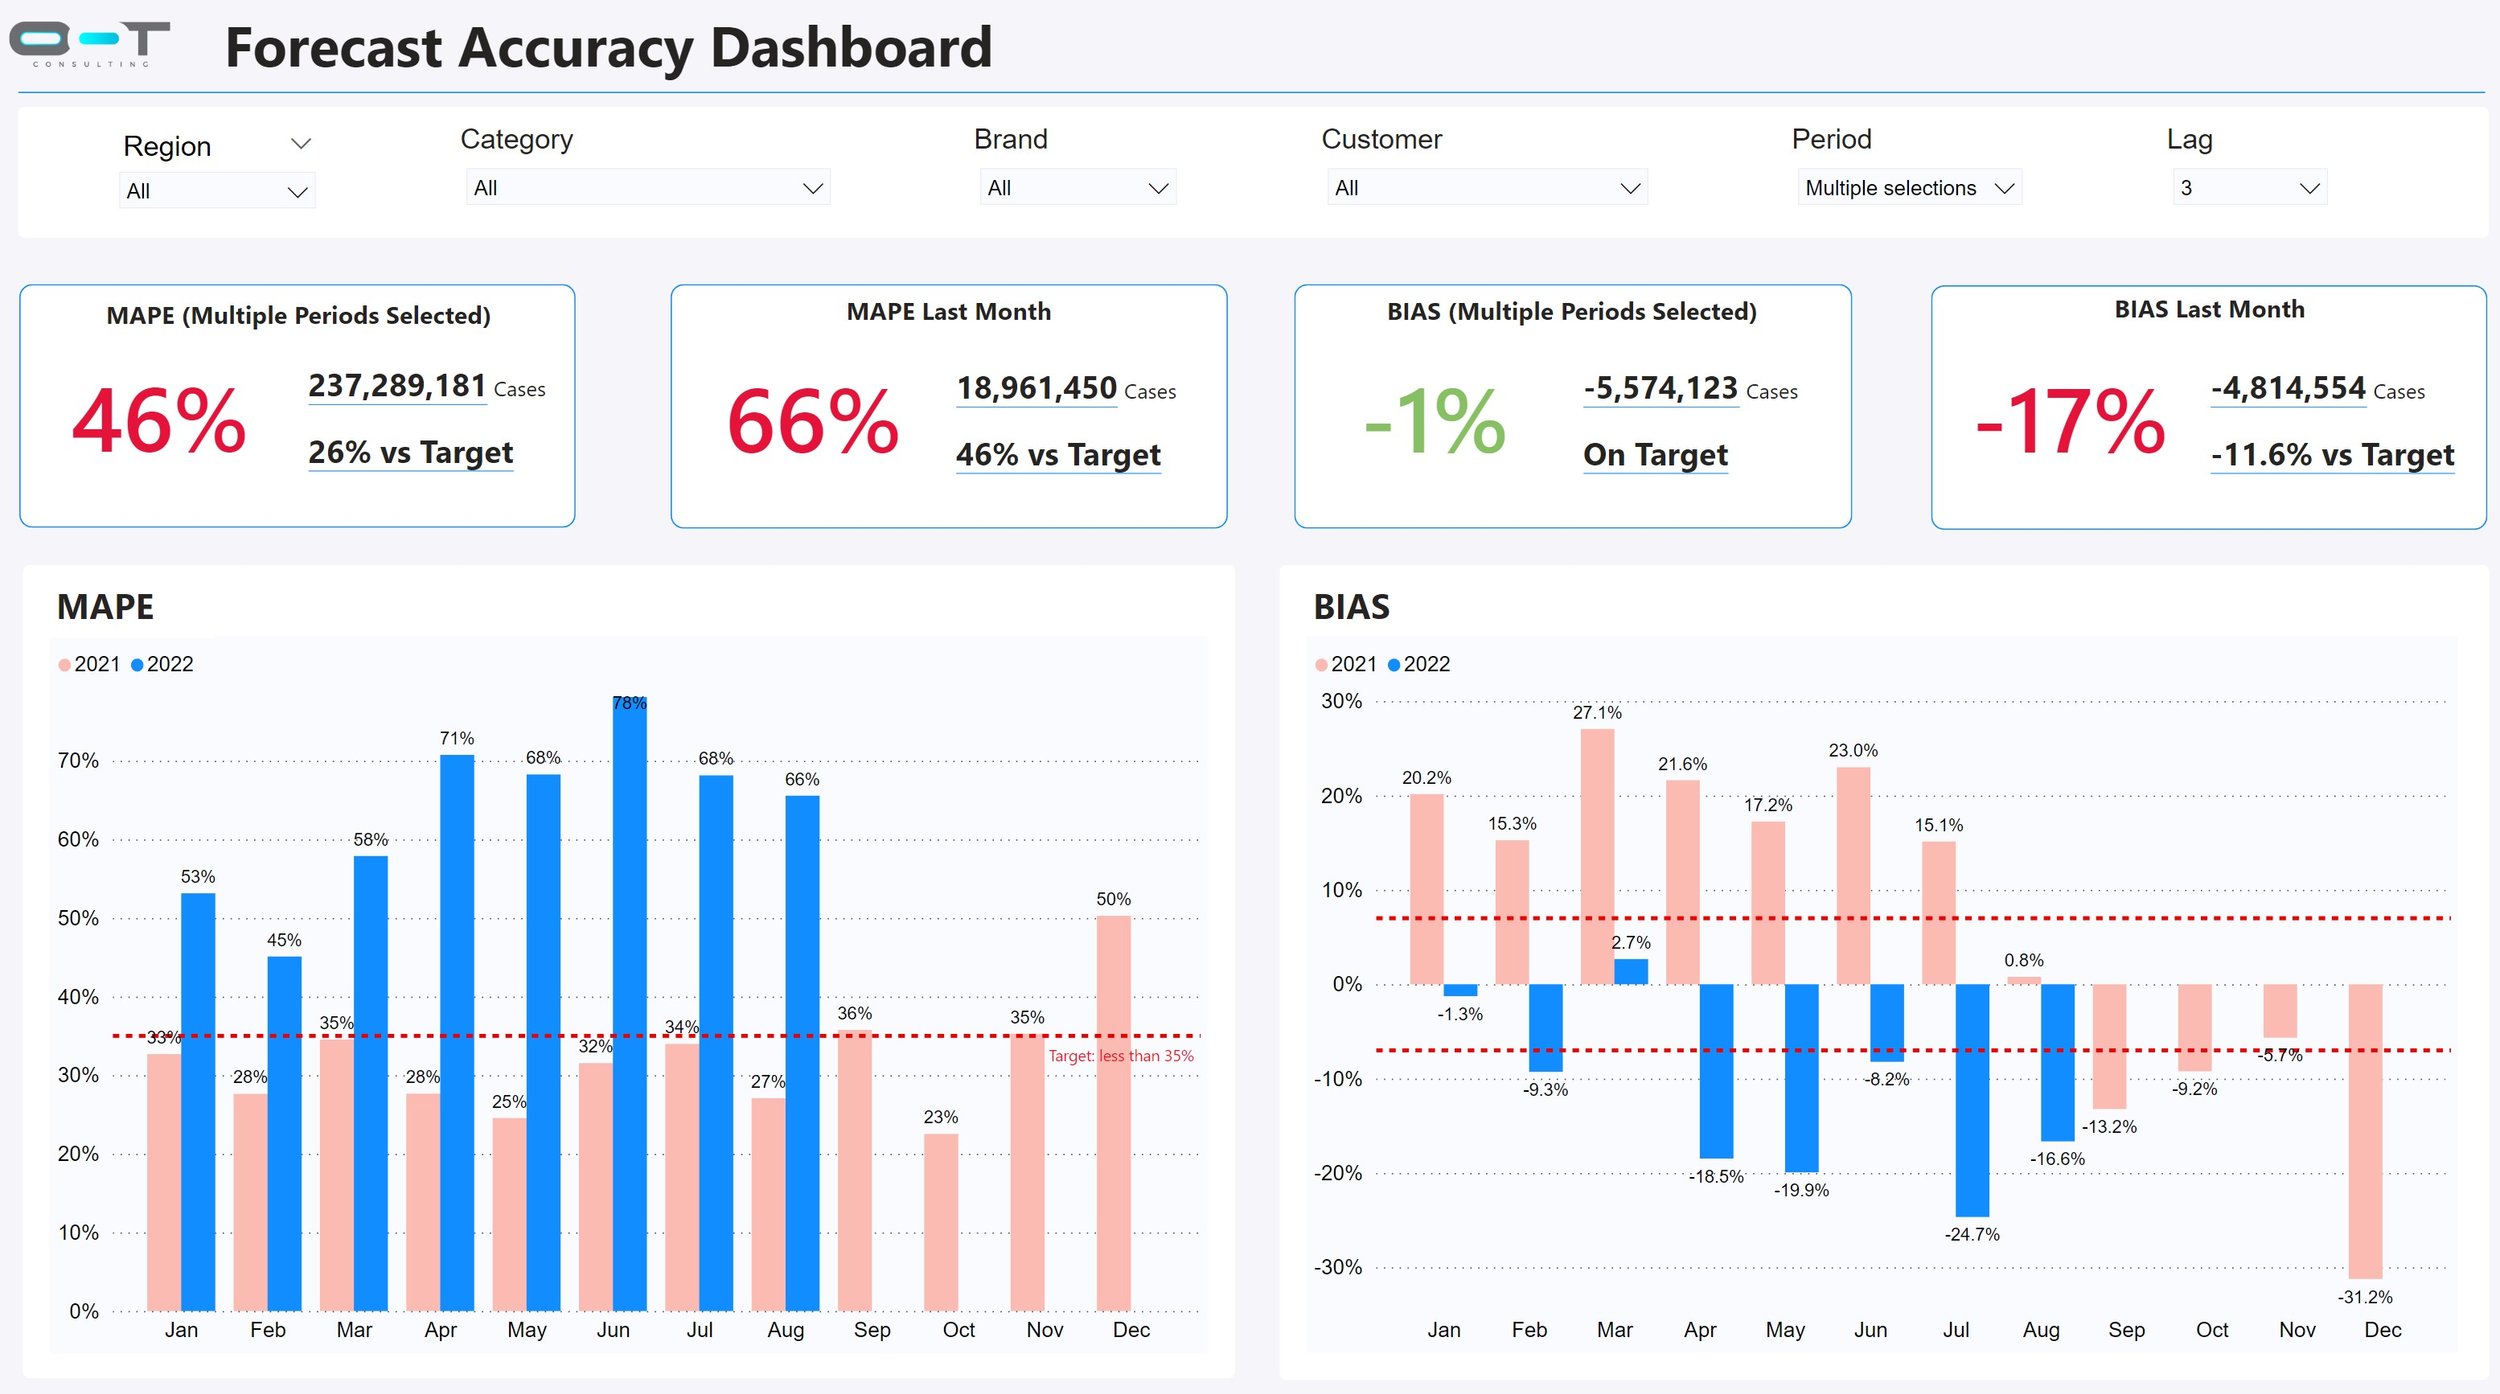
Metrics: MAPE (Mean Absolute Percent Error), BIAS (persistent forecast error), MAD (Mean Absolute Deviation), Tracking Signals, MSE (Mean Square Error), RMSE (Root Mean Square Error).
No. of screens: 7
Business Capabilities and Features:
Performance Metrics Overview: A concise summary showcasing essential metrics like MAPE (Mean Absolute Percentage Error), MPE (Mean Percentage Error), RMSE (Root Mean Square Error), allowing an immediate understanding of overall accuracy.
Granular Accuracy Analysis: Dive deep into specific forecasts or segments, enabling detailed examination of accuracy at various levels—product lines, regions, time periods, etc.
Forecast Error Distribution: Visual representations of forecast errors, histograms providing insights into the distribution and frequency of errors across different periods.
Trend and Seasonality Insights: Identification and visualization of recurring patterns or trends within data, helping to adjust forecasts accordingly and reduce error caused by seasonality.
Outlier Detection: Highlighting anomalies or outliers in the data that might impact forecasting accuracy, allowing for corrective actions or adjustments in the models.
Drill-Down Capabilities: Navigate from high-level summaries to more detailed views effortlessly, facilitating a deeper understanding of accuracy drivers and insights.
Customizable Reports: Tailor dashboards or reports to suit specific business needs, allowing users to focus on critical metrics relevant to their decision-making.
Overview: Our Forecast Accuracy Dashboard is the ultimate tool designed to empower your strategic decision-making process by providing in-depth insights into your forecasting performance. This cutting-edge dashboard is a comprehensive solution tailored to help you evaluate and optimize your forecasting accuracy with ease.
Metrics: MAPE (Mean Absolute Percent Error), BIAS (persistent forecast error), MAD (Mean Absolute Deviation), Tracking Signals, MSE (Mean Square Error), RMSE (Root Mean Square Error).
No. of screens: 7
Business Capabilities and Features:
Performance Metrics Overview: A concise summary showcasing essential metrics like MAPE (Mean Absolute Percentage Error), MPE (Mean Percentage Error), RMSE (Root Mean Square Error), allowing an immediate understanding of overall accuracy.
Granular Accuracy Analysis: Dive deep into specific forecasts or segments, enabling detailed examination of accuracy at various levels—product lines, regions, time periods, etc.
Forecast Error Distribution: Visual representations of forecast errors, histograms providing insights into the distribution and frequency of errors across different periods.
Trend and Seasonality Insights: Identification and visualization of recurring patterns or trends within data, helping to adjust forecasts accordingly and reduce error caused by seasonality.
Outlier Detection: Highlighting anomalies or outliers in the data that might impact forecasting accuracy, allowing for corrective actions or adjustments in the models.
Drill-Down Capabilities: Navigate from high-level summaries to more detailed views effortlessly, facilitating a deeper understanding of accuracy drivers and insights.
Customizable Reports: Tailor dashboards or reports to suit specific business needs, allowing users to focus on critical metrics relevant to their decision-making.
Prerequisites:
You need to have Power BI Desktop installed in your computer before opening the PBIX File.
You need to have MS Excel installed in your computer before opening the sample file.