 Image 1 of


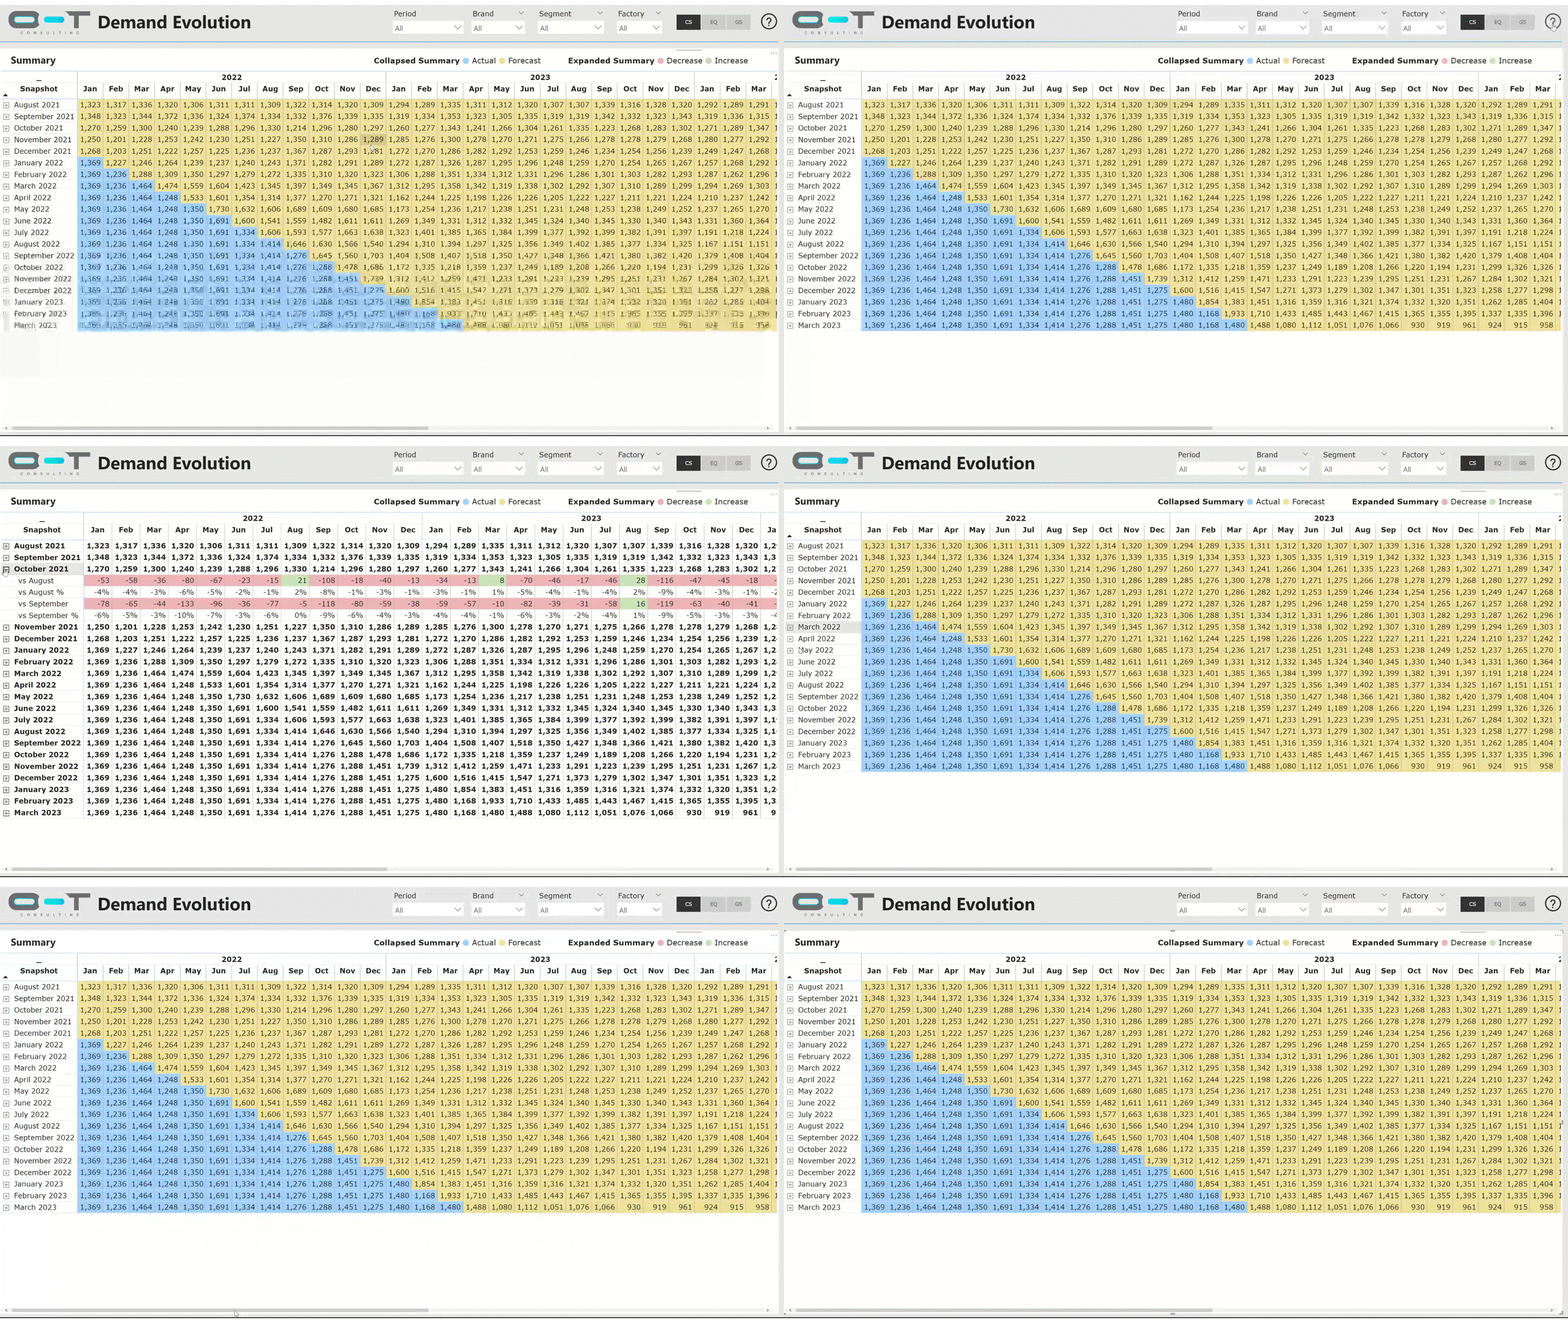
Demand Evolution Dashboard
Overview: Our Demand Evolution Dashboard is one-click dashboard to get to know the changes in the demand plan. This user-friendly dashboard helps you understand the changes between two snapshots at different granularities.
Metrics: Current Forecast, Previous Forecasts, Actuals (Shipments), Variance, Variance %
No. of screens: 4
Business Capabilities and Features:
Historical Demand Analysis: Visualize historical demand patterns over time, allowing users to understand past trends, seasonality, and fluctuations in demand.
Forecasted Demand Comparison: Compare forecasted demand against actual demand, enabling a clear view of accuracy and deviations to fine-tune future predictions.
Customer Behavior Insights: Gain insights into customer behavior and preferences that influence demand, enabling targeted marketing or product development strategies.
Customizable Reporting: Customize dashboards and reports to fit specific user needs, allowing users to focus on key metrics and tailor visualizations to their requirements.
Dynamic Top / Bottom N variances
Demand Bridge
Root Cause Analysis with Reason Codes
In-page Q&A
Prerequisites:
You need to have Power BI Desktop installed in your computer before opening the PBIX File.
You need to have MS Excel installed in your computer before opening the sample file.

